Introduction
Support vector machines are supervised learning algorithms that help classify things into different groups. Supposed that the shapes below had to be separated somewhere on the line. Where should the line be drawn?

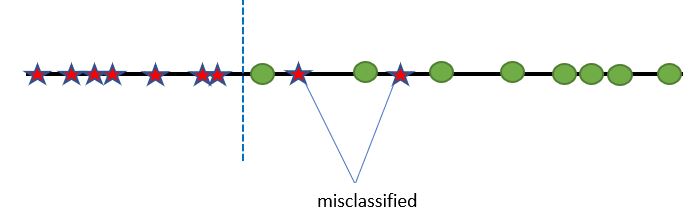
It could be drawn line this, which might allow for some misclassification:
In this example, it’s pretty intuitive that the dividing line should be placed somewhere in the middle:
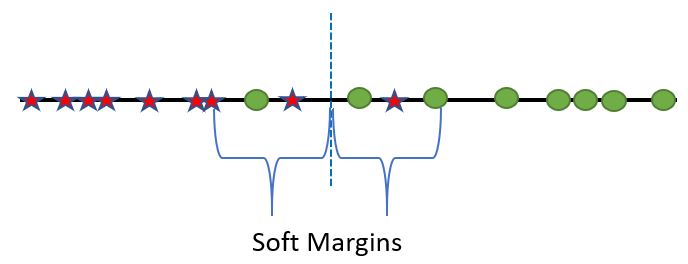
Doing so means that soft margins have been established, thus allowing for some misclassification for the sake of a more general model that can most likely better predict new information. In essence, this is what support vector machines do–they determine where to draw the line of classification, which is known as the support vector classifier (or SVC for short)
Vectors and the Kernel Trick
Of course, real life classification is rarely as simple that a line the separates green and red. In fact, it can be rather confounding to have to draw a single classification line for the following example:

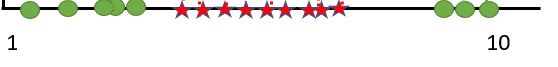
This one dimensional example reveals that drawing a single classification line will inevitably lead to some misclassification. If anything, two division lines are needed, but that would imply that there are 3 different classes, when there are only two (Ie. green circles and red stars). So how do support vector machines draw a single classification line that’s able to adequately separate the two groups? The answer involves a bit of mathematically wizardry.
Assume that the line from above is now a number line and that each object on the line has a singular value with items on the left having a lower value and items on the right having a higher value. For reference, it can be assumed they are between 1-10:
Since each shape now has a single value associated with it, the shapes are now known as a 1D vector. SVM then turns this 1D vector for each object into a 2D vector. In laymen’s terms, that means there are now two numbers that are associated with each object. What should be the second number? For simplicity sake, let’s assume it is the first number squared. For example, if a red star has a first value of 5, then its second value would be 25, thus making the 2D vector 5 and 25.
2D vectors may look familiar because they can essentially be represented as point on a coordinate grid! Thus, every point on the original number line can be transposed onto a coordinate graph like so:
 Now let’s return to the original question: how can one draw a single line to separate two classes? It should be much easier now that the data is in 2-dimensions:

This is pretty much the essence of the kernel trick! SVMs transform data as if they are in a higher dimension in order to find a better SVC.
The example used here is extremely limited because it only deals with classification of two different objects. If a third object was present, there would need to be an additional SVC line and so forth. In addition, while this example has primarily used a straight-lined SVC there are other ways (Ie. kernels) that use different methods to draw the classification:

The scope of how these kernels work and differ from each other is beyond the scope of this post, but feel free to read up on it here, but know that some math will be needed.
