Numbers do not lie, and in our technological era, there is an unprecedented amount of numbers that can provide extremely valuable insight into every sector of the economy. The ability to take this data and digest it properly falls on the shoulders of data scientists.
At its most elementary level, analyzing data requires calculating the correlation between different factors in explaining a grander outcome. One method for doing so is linear regression, which constructs a line of best fit based on the present data. By looking at the R-squared value of the line, the overall fit of the linear regression model can be evaluated.
The question that many data scientist face is how to improve the fit of their model. Real-world data rarely follow bell curve distribution, and even after adjustments and transformations, it can still be difficult to narrow down a specific model that correctly indicates how much different predictors (independent variables) can influence a particular result (the target or dependent variable).
It may be tempting to include as many independent variables as possible in order to accommodate all possibles factors that affect the dependent variable, which does indeed increase the R-square value of any model. However, any increase may simply be due to chance, which justifies use of the adjusted R-square value.

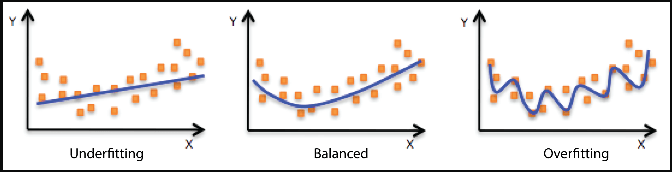
The conundrum is determining both how many and which predictors to include in the final model. If there too few predictors, the model will be underfitted and fail to accurately describe the relationship between the target variable and each included feature. Meanwhile, including too many features will lead to a model that is overfitted and fails to predict future data points effectively. Therefore, selecting an optimal number of features also means selecting the best features that explains the variability within the target variable. Luckily, data scientists have a number of techniques at their disposal in tackling this task.
In forward selection, the feature that increases R-squared (or adjusted R-squared) the most is added to the model at every step until there are no longer any statistically significant variables remaining. A popular modification to this is stepwise selection, which includes the extra step of evaluating all previously added variables to see if their significance falls below a predetermined threshold. If so, the feature is eliminated from the model; this is the primary advantage of stepwise selection over forward selection
Another technique is recursive feature elimination, which ranks n most important features, as specified by the user. This function works by recursively eliminating the least important features from a given set of features until the specified n amount of features is left. Features are then given a rank, with 1 being assigned to the most important features. One useful attribute of this class is the ranking_[i] attribute, which returns the rank of the feature at that specific index.
Equally important to selecting correct features for a model is the goal of selecting the correct number of features as well. It is possible that many features have statistical significance in explain the target variable, but including many or all of them may lead overfitting. Yet, without additional new data, it can be difficult to tell if one’s current model has a balanced fit
One of the main way scientists answer this question is to see how well a model already predicts known data. This can be done via test-train-split, which divides any data set into training data and testing data, as shown below:
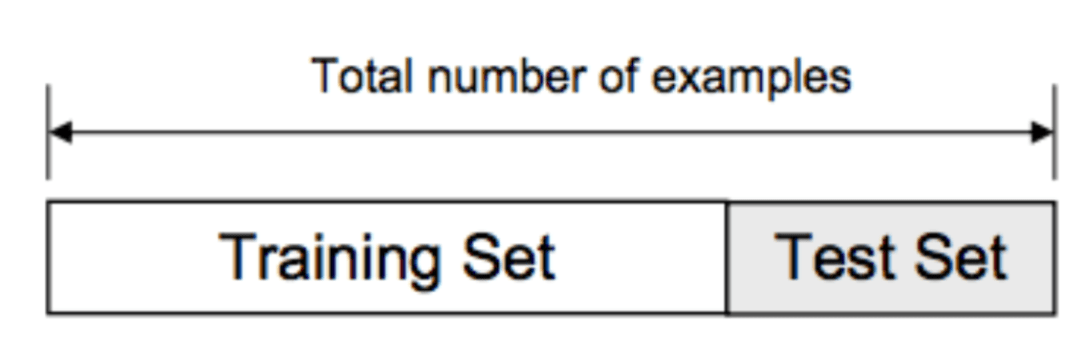
The idea is pretty simple. A small part of the dataset is reserved as the test set (usually about 20%, unless the total data size is very small). The rest of the data, known as the training set, is used to construct a model, which is then compared with data from the test set. This allows data scientists to see the predictive capabilities of their constructed model without requiring new data.
Of course, test-train-split on its own is subjected to a degree of variation. Depending on how the test set is chosen, even if it is selected randomly, the mean-squared error (MSE) of both training and test sets may be significantly different. This is especially true for real-world data, which rarely follows normal distribution. Therefore, test-train-split can be improved with K-fold cross validation.
The concept is similar to test-train-split except that the test data is not randomly selected. Instead, the entire dataset is divided evenly into k folds. Through each iteration, one fold serves as the test data while the rest of the data becomes the training data, as shown below: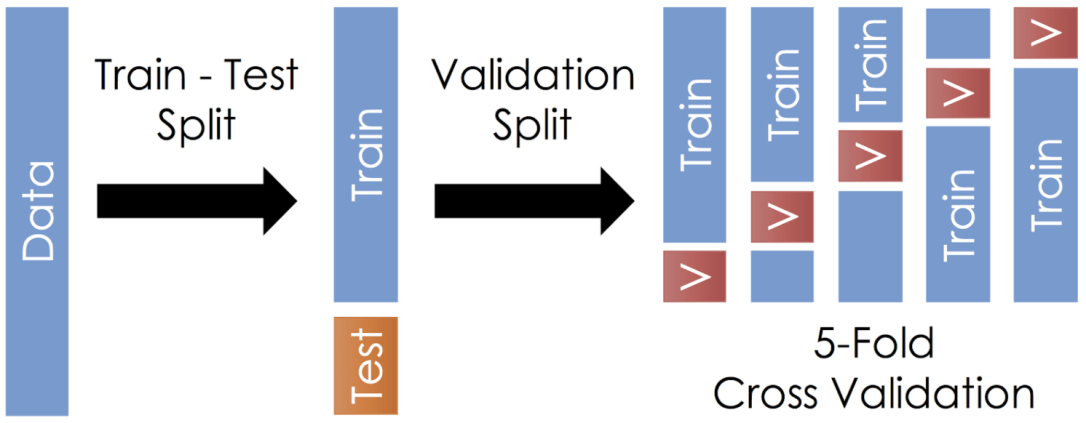
The function averages the result of all the models, which helps eliminate noise and variability due to test-train-split’s random selection. As a result, the average MSE from K-fold cross validation is much closer to the actual MSE of the model.
Taken to the extreme, it is possible to divide the data into a number of folds equal to the number of entries in the data in a process called leave-one-out cross validation. That way, each data entry can serve once as the test set with the rest of the data becoming the training set.

The benefit of this approach would be an even more accurate MSE due to each iteration being averaged. Yet, this is computationally expensive, especially for big data sets, so it should only be used for a smaller number of data entries.
Through stepwise selection and recursive feature elimination, data scientist gain understanding of which features best explains the variability within the target variable. To ensure that they optimize for model fit, however, it is necessary to apply cross-validation to avoid overfitting. Depending on the result from cross-validation, a data science may need to reevaluate which features they choose to include in the overall model, which is what makes model construction an iterative process.
Constructing a model that explains current data and predicts future data is tantamount to the primary responsibility of a data scientist. A well-constructed model sheds light on the unique relationships between different factors, which is invaluable to business, as well as social, decisions.