
It’s fine to celebrate success, but it is more important to heed the lessons of failure. -Bill Gates
A Preface:
To be blunt, I have failed. More accurately, my models have failed (by ironically being not accurate, all pun intended). Despite weeks of work, I have failed to provide anything conclusive about the objective of my investigation. If a how-to for a data science inquiry is your purpose, I suggest you stop here (unless you are a potential employer. In which case, please continue reading). However, I hope that my failure bear some enlightenments for curious eyes and aspiring data scientists as they have done for me. After all, the data science project is an iterative process, so, as they say, if at first you don’t succeed, try, try again.

Introduction:
Having lived in Seoul, South Korea, I’ve really, really, really come to despise the American health care system with its multiple redundancies, inefficiencies, and high costs. Americans, for some reason, really despise social health care, but I dare anyone to get sick in Seoul and try complaining about finding a doctor and medical care; it is beyond simple and cost efficient. But perhaps what makes me most irate is how everything is continuously shrouded in secrecy. As Vox pointed out, it is impossible to really find concrete prices for anything. Something simple and necessary like pregnancy delivery can wind up costing hundreds to the tens of thousands based on the hospital, complications, and one’s insurance. Yet, for a society that prizes itself on laisses-faire economics, the health care system is surprisingly unaffected by free-market forces. A small part of this is due to psychology: people don’t perform cost-benefit analysis about their health the same way as they would when buying a television. In pretty much all cases, people will opt for the best health care possible because our self-preservation instinct dictates so. The bigger reason is that competition is effectively negated with healthcare. Hospital’s chargemasters—a list of services along with their respective costs—are never disclosed and arbitrary loopholes in patent laws make securing many drugs exponentially more expensive than their cost of production (E.g. insulin and Epipens). The latter is a separate issue of equal importance, but this study deals primarily with the former. Ie. Consumers have no way “shop-around” when it comes to health care, thus preventing market pressure from driving down prices. Therefore, this study attempts to find another method for determining a hospital cost-effectiveness in a way that will allow consumers to make informed choices.

Methodology
Health care data, especially when it comes to finances is extremely hard to find. Luckily, medicare.gov contains medicare spending data along with other hospital attributes for many providers across the US. Spending data along with 4 other datasets (complications, voc, psi, and infections) were formatted and combined such that every provider occupied only a single column in the final dataframe. See below:
From
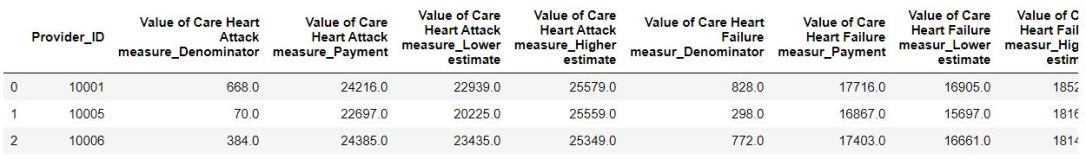
To
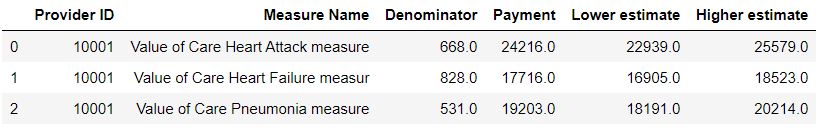
Unfortunately, even the government cannot penetrate the vague nature of medical finances, as many of the metrics were missing, including one-fourth of the spending data. This will prove to be the crux of this study. Therefore, much of the data had to imputed or assumed with algorithms. In fact, less than 1000 providers had fully intact data without null values. Overall, there was initially over 140 attributes for each provider.
Train and test data was performed with a 90:10 split. The test data was composed exclusively of providers without any imputed values, since this would lend more external validity.
Using RFE, only the 50 most important attributes were selected for OLS modeling.
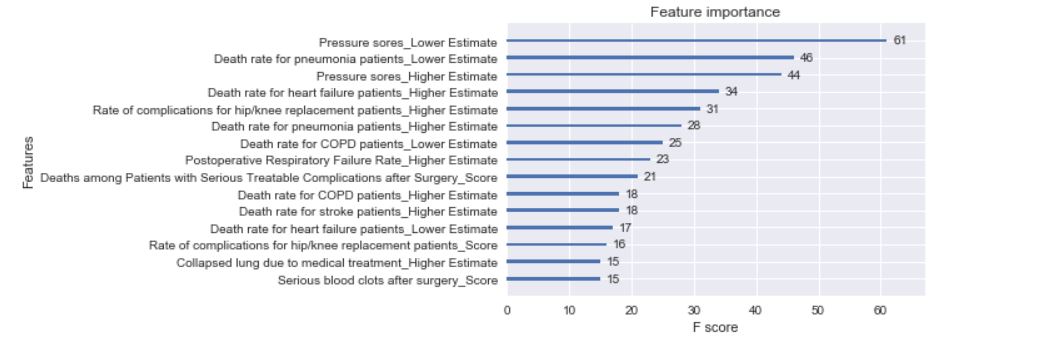
Other than pressure sores, the most important features seemed to revolve around death and complications, which seems intuitive as that would affect the spending score.
Afterwards, a heatmap was constructed to see which variables correlated with each other, as measure known as multicollinearity. Ideally, each variable would correlate exclusively with the target variable (Spending), but things rarely go smoothly.

The areas above indicate which features are collinear. Expectedly, since some measures have a denominator, lower and upper estimate as scores, it is unsurprising that these are correlated with each other. In addition, a lot of the complications around death are also correlated.
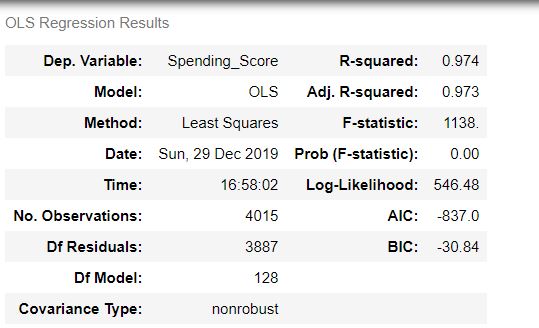
The OLS model seemed to predict the training data exceptionally, as indicated by the adjusted R2-score. However, when compared against the test data, this score fell to -3.8. In other words, it performed much worse than simply taking the mean of the data.

The reason was obvious—there wasn’t sufficient real data. Despite fitting the training data well, the model performed grotesquely against the test data of real-world, non-imputed values. This logically mean that the imputation algorithm could not accurately match trends in the data, which also implies that there was a lack of data to begin with. Nonetheless, I carried on in optimistic denial hoping that perhaps machine learning could work its magic.
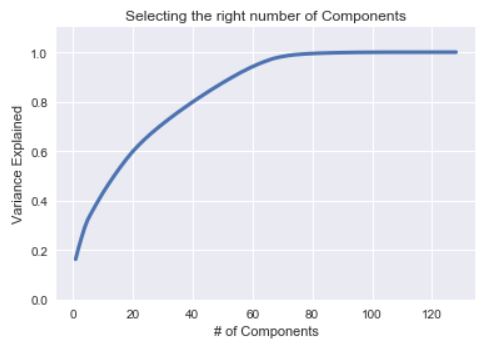
PCA to Reduce to 62 Components
Error Plot for Machine Learning

Sadly, I was forced to face my delusion. Both XGBoost and Random Forest algorithms performed poorly as well (albeit not as badly as OLS) with a score of -.3 and -.9 against the test data. These scores only improved once I repeated the model against train and test data that was randomly split, but there would be no external validity then.
Improved Scores and Predictions, but lacking External Validity

It would mean nothing if the models performed well against imputed data (even if it contained some real data) because it was already indicated that the imputed data was significantly different than the real data. Rather, I’m stuck with three models that perform worse than simply guessing the mean score of the test data, which is unreliable to say in the least.
Takeaways:
There is a reason why OSEMN begins with O for Obtain and why companies like Facebook, Google, and Amazon pay billions for enormous quantities of good data. Without such data, no amount of algorithm or predictive analytics can truly predict what will happen. At worst, there will simply be a confirmation bias for what has happened. Yet, this investigation was the first failure of possibly many. Data science is an iterative process that does not require starting from scratch with each failure. Many of the exploratory and modeling techniques conducted are easily reusable with sufficient data, and that will always the silver lining. Though in the business environment, investing time and resources into obtaining such data will always be discretionary.
